Recognized by industry leaders:


Research Solutions for Renewable Energy


Renewable Energy Industry Overview: 2026
Summary of Report Contents
Our published research has been industry proven as a consistently reliable source of market intelligence for many years. Through our work publishing research reports and consulting on energy equipment markets, we have been able to offer clients valuable insights into new and existing markets.
The report contains over 150 pages and over 125 charts/graphs.
Scope of Coverage
The following categories present how the data was developed, organized and is presented. Breaking the data into specific categories is essential to analyze and draw meaningful insights. The breakdowns are designed to highlight key patterns and trends in the data, as well as to facilitate comparisons between different groups or segments.
Each section contains quantitative market data including market by consumption value (US$Millions), volume (UnitsMillions) and average selling price (US$/Unit). Data tables and visualizations include breakdowns by country, end-user industry & applications, operating frequencies, packaging and connector types, and supplier sales & market share. Data is given for the years 2024-2030 by year with 2024 as the base year, 2024 as the estimate year, and 2030 as the forecast year.
Research Objectives
The primary objectives in this analysis are:
- To provide clients with the tools they need to accurately assess market size, opportunities, and future potential;
- To quantify the total global market by energy types, end-user industry consumption, and growing energy demand by country;
- To forecast future growth in each product by geographic and end-use market; and
- To assess the competitive environment within the market including supplier sales and market share.
Methodology & Sources
Dedalus Consulting employs all current market and competitive intelligence techniques in order to ensure comprehensive research and analysis. This includes primary and secondary research. The research methodology applies generally to all database services, published and custom research. It can also be modified to suit a project and the client’s specific objectives.
To read more about our methodology, please see our dedicated methodology page.
Energy Types Covered
- Coal
- Oil
- Natural Gas
- Nuclear
- Renewable Energy
- Solar
- Wind
- Biofuels
- Hydro-electric
- Geothermal
Geographic Coverage
- Africa
- Australia
- Brazil
- Canada
- China
- France
- Germany
- India
- Italy
- Japan
- Korea
- Mexico
- Middle East
- Russia
- Singapore
- Spain
- Sweden
- Switzerland
- Taiwan
- United Kingdom
- United States
- Other Asia/Pacific
- Other CIS
- Other EU
- Other Europe
- Other Latin America
- Rest of World
End-User Markets
- Aerospace
- Automotive
- Chemical Processing
- Communications
- Commercial
- Construction
- Defense/Military/Government
- Electronics
- Food Processing
- Machining
- Medical/Research
- Oil, Gas & Mining
- Paper & Pulp Industry
- Power Generation
- Residential
- Transportation
- Other
Timeframe
- Ulysses™ Data Subscription Service *
- Standard Package: 2016-2024, 2030
- Published Research
- 2024 base year
- 2019 estimated
- Forecasts: 2019-2024, 2030
Section One: Technology Overview
Types of Energy Defined
- Coal
- Oil
- Natural Gas
- Nuclear
- Renewable Energy
- Solar
- Wind
- Biofuels
- Hydro-electric
- Geothermal
Comparison by Energy Types
- Efficiency (%)
- Cost ($/kWh)
Plant Construction Costs by Energy Type
Capital Cost Comparison by Plant Size (kWh) – Renewable Energy
Manufacturing Renewable Energy
Solar Power (Photovoltaics)
- Photovoltaics (PV) Generally
- Process of Energy Generation
- Advanced Materials Used
- Developing Photovoltaic Energy Sources
- First Generation
- Monocrystalline Silicon
- Polycrystalline Silicon
- Mono-like-multi Silicon
- Second Generation Thin Film Technologies
- Cadmium Telluride (CdTe)
- Copper Indium Gallium Selenide (CIGS)
- Amorphous Silicon (a-Si)
- Micromorphous Silicon
- Gallium Arsenide (GaAs)
- Comparing First and Second Generation (Crystalline vs. Thin Film)
- Third Generation
- Light-absorbing Dyes
- Quantum Dots
- Titanium Dioxide
- R&D into Developing Solar Powered Energy Sources
- Crystalline Silicon
- Thin Film Cells
- Multi-Junction Cells
- OPV (Organic Photovoltaic)
- Dye Sensitized
- CPV (Concentrated Photovoltaic)
Wind Power
- Process of Energy Generation
- Equipment and Products Used
- Horizontal Axis (HAWT)
- Upwind
- Downwind
- Shrouded
- Vertical Axis (VAWTS)
- Darrieus
- Savonius
- Flapping Panel
- Giromill
- Tower
- Rotor Blades
- Generators
- Bearings
- Pitch System
- Other Technology
- Cost of the Wind Turbine
- Advanced Materials Used
- Lightweight/Durable Materials
- Core material
- Skin material
- Root material
- Fibers
- Other Materials
- Supply: Transmission & Distribution
- R&D into Developing Wind Powered Energy Sources
- Off-Shore R&D
- Next Generation
- Blades & Drive Train
Hydropower
- Process of Energy Generation
- Equipment and Products Used
- Turbines
- Impulse
- Reaction
- Other Components
- Pumps
- Generators
- Valves
- Intake
- Penstock
- Drive system
- AC Controls
- DC Controls
- Coanda screens
- Advanced Materials Used
- E-Glass
- Carbon Fiber
- Cermet
- Polymer Matrix
- Synthetic/natural Fiber
- Steel
- Martensitic steel
- Austenitic steel
- Nitronic 60
- ASTM CF-10SMnN
- UNS S21800
- AWS ER 218
- Supply: Transmission & Distribution
- Examples of Installed Systems
- Three Gorges Dam, China
- Itaipy Dam, Brazil/Paraguay
- Xiluodu, China
- Guri, Venezuela
- Tucurui, Brazil
- Xiangjiaba, China
- Grand Coulee, USA
- Kransnoyarsk, Russia
- Robert-Bourassa, Canada
- R&D into Developing Hydroelectric Energy Sources
Biofuels/Biomass
- Process of Energy Generation
- Combustion
- Anaerobic digestion
- Pyrolysis
- Gasification
- Equipment and Products
- Automated System Controls
- Furnace
- Combustor
- Fuel Storage/Handling Equipment
- Boiler
- Emissions Controls/Exhaust Systems
- Cooling Tower
- Pumps
- Fans
- Condenser
- Generator
- Steam Turbine
- Advanced Materials Used
- Microporous/Mesoporous Acids
- Catalysts
- Advanced Acid Gas Solvents
- Fixed Bed Catalysts
- Fluidized Bed Catalysts
- R&D into Developing Biofuel/Biomass Energy Sources
- Hydrogen Fuel Cells
- Methane
- Microalgae
- Biomass-to-liquids (BTLs)
- Genetic engineering
Geothermal Energy
- Process of Energy Generation
- Equipment and Products
- Dry Steam
- Flash Steam
- Binary Cycle
- Heat exchanger
- Advanced Materials Used
- Mechanical Components
- Coatings
- Well Cement Processes
- Well Cement Materials/additives:
- Other
- R&D into Developing Geothermal Energy Sources
- Geothermal Systems
- Enhanced (EGS)
- Hidden
- Deep
- Predictive Modeling/Technologies for Exploration
- Drilling
- Casing
- Well Construction
- Risk Reduction
- Condensers for Higher Temperature
Section Two: Market Overview
General Trends
- Total Energy Demand by Region
- Top Energy Producing Countries by Fuel Type
- Trends & Forecasts in Energy Consumption
- Forecasted Energy Production by Fuel Type
- Factors Affecting Demand
Industry Trends & Forecasts
- High-growth Markets (CAGR by Year)
- Reduction of Energy Costs
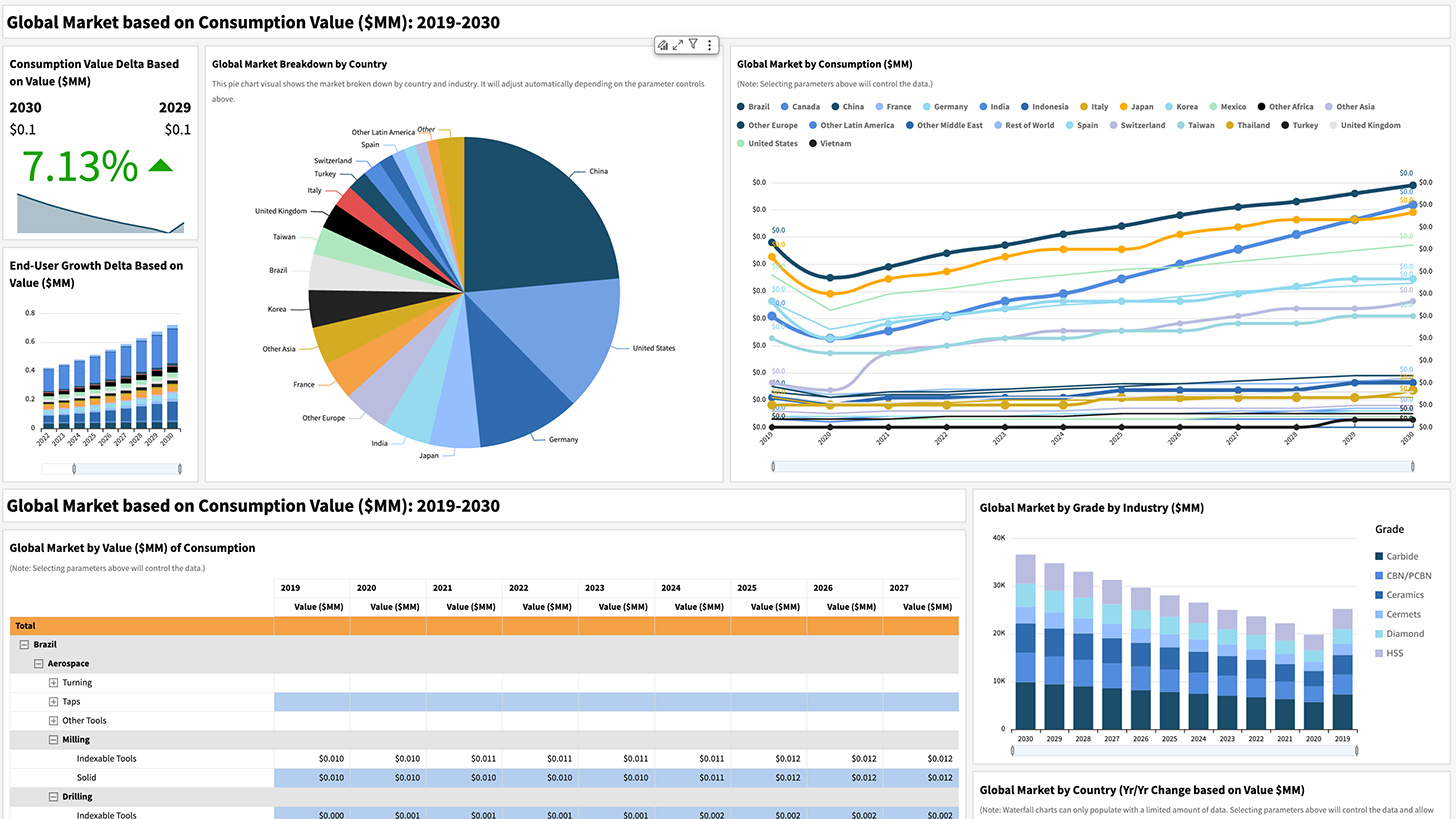
Global Market Value of Renewable Energy Equipment by Energy Type ($MM): 2024-2040
List of Tables
- Table 1.1 Comparison of Types of Electricity ($/kW-hr)
- Table 1.2 Comparison of Types of Electricity (% Efficiency)
- Table 1.3 Comparison of Electrical Plants Cost ($/kW)
- Table 1.4 Capital Cost/Capacity Comparison
- Table 1.5 Wind Turbine Main Components (% of cost)
List of Tables by Section
Section One: Industry Overview
Historical and Forecasted Energy Demand by Region and Fuel Type: 2024-2040
- Table 2.1 Global Demand of Energy by Region (Quadrillion BTU): 2024-2040
- Table 2.1a Global Demand of Energy by Region (%): 2024-2040
- Table 2.2 Global Demand of Energy by Type (Quadrillion BTU): 2024-2040
- Table 2.2a Global Demand of Energy by Type (%): 2024-2040
- Table 2.3 Energy Demand Projections Africa by Type (Quadrillion BTU): 2024-2040
- Table 2.3a Energy Demand Projections Africa by Type (%): 2024-2040
- Table 2.4 Energy Demand Projections Asia by Type (Quadrillion BTU): 2024-2040
- Table 2.4a Energy Demand Projections Asia by Type (%): 2024-2040
- Table 2.5 Energy Demand Projections Europe by Type (Quadrillion BTU): 2024-2040
- Table 2.5a Energy Demand Projections Europe by Type (%): 2024-2040
- Table 2.6 Energy Demand Projections Latin America by Type (Quadrillion BTU): 2024-2040
- Table 2.6a Energy Demand Projections Latin America by Type (%): 2024-2040
- Table 2.7 Energy Demand Projections North America by Type (Quadrillion BTU): 2024-2040
- Table 2.7a Energy Demand Projections North America by Type (%): 2024-2040
- Table 2.8 Energy Demand Projections Middle East by Type (Quadrillion BTU): 2024-2040
- Table 2.8a Energy Demand Projections Middle East by Type (%): 2024-2040
Global Production of Traditional Energy Sources by Fuel Type: 2024-2040
- Table 2.9 Top Coal Producers by Region (Mt): 2024-2040
- Table 2.9a Top Coal Producers by Region (%): 2024-2040
- Table 2.10 Top Oil Producers by Region (Mt): 2024-2040
- Table 2.10a Top Oil Producers by Region (%): 2024-2040
- Table 2.11 Top Gas Producers by Region (Mtoe): 2024-2040
- Table 2.11a Top Gas Producers by Region (%): 2024-2040
- Table 2.12 Top Nuclear Producers by Region (Mtoe): 2024-2040
- Table 2.12a Top Nuclear Producers by Region (%): 2024-2040
Global Production of Renewable Energy Sources by Region: 2024-2040
- Table 2.13 Top Hydro Producers by Region (Mtoe): 2024-2040
- Table 2.13a Top Hydro Producers by Region (%): 2024-2040
- Table 2.14 Top Geothermal Producers by Region (ktoe): 2024-2040
- Table 2.14a Top Geothermal Producers by Region (%): 2024-2040
- Table 2.15 Top Wind Producers by Region (Mtoe): 2024-2040
- Table 2.15a Top Wind Producers by Region (%): 2024-2040
- Table 2.16 Top Solar Producers by Region (MW Installed Capacity): 2024-2040
- Table 2.16a Top Solar Producers by Region (%): 2024-2040
Global Consumption of Traditional Energy Sources by Fuel Type: 2024-2040
- Table 2.17 Top Consumers of Oil by Region (Mt): 2024-2040
- Table 2.17a Top Consumers of Oil by Region (%): 2024-2040
- Table 2.18 Top Consumers of Gas by Region (Bcm): 2024-2040
- Table 2.18a Top Consumers of Gas by Region (%): 2024-2040
- Table 2.19 Top Consumers of Coal by Region (Mt): 2024-2040
- Table 2.19a Top Consumers of Coal by Region (%): 2024-2040
- Table 2.20 Top Consumers of Nuclear by Region (terawatt hours): 2024-2040
- Table 2.20a Top Consumers of Nuclear by Region (%): 2024-2040
Global Consumption of Renewable Energy by Region: 2024-2040
- Table 2.21 Top Consumers of Hydro by Region (Billion KwH): 2024-2040
- Table 2.21a Top Consumers of Hydro by Region (%): 2024-2040
- Table 2.22 Top Consumers of Solar by Region (TwH): 2024-2040
- Table 2.22a Top Consumers of Solar by Region (%): 2024-2040
- Table 2.23 Top Consumers of Wind by Region (TwH): 2024-2040
- Table 2.23a Top Consumers of Wind by Region (%): 2024-2040
- Table 2.24 Top Consumers of Geothermal by Region (MW Installed Capacity): 2024-2040
- Table 2.24a Top Consumers of Geothermal by Region (%): 2024-2040
Global Consumption of Renewable Energy by End-User: 2024-2040
- Table 2.25 Global Consumption of Energy by End-User: 2024-2040
Competitive Environment of Renewable Energy Markets by Type
- Major PV Companies Revenue and Sales Growth
- Major Wind Turbine Manufacturers Market Share
- Major Hydroelectric Power Plants Installed Capacity
- Top Geothermal Plants Installed Capacity
- Major Biofuel Companies

Ulysses™ is a dashboard-based, on-demand market intelligence platform that delivers dynamic, multi-dimensional data access rather than static reports. Built on over two decades of our trusted knowledge base and expertise, the Specialized Industrial Components database is populated by millions of data points per product group, spanning historical data from 2004 through forecasts to 2040.
The platform operates as a 24/7/365 accessible research tool that allows users to conduct custom searches across multiple variables—including country, product categories, end-user industries, and specific applications—enabling precise market analysis tailored to individual business needs. Users can seamlessly generate custom reports, export data as CSV files or excel workbooks, prepare pivot tables and visual presentations, and access both quantitative metrics and qualitative insights covering competitive analysis, market drivers, and distribution channels. The platform's scalability ensures it can adapt to different organizational requirements and budgets by offering different licenses and subscription levels while maintaining depth and reliability in quarterly updates.
Revision Date: December 2025
Datapoints: 100 Million+
Parametric Breakdowns: Year, Country, End-User Industry, Product Type, Application, Form Factor, Distribution Channels, Competitive Environment and more...
Companies Researched: 150+
Years Covered: 2004-2024 Actual, 2025 Estimate, 2026-2040 Forecasts
Delivery Method: Online Dashboards with Downloadable CSV Options Depending on License/Package

Dedalus Consulting's Data on Demand service provides fast, targeted market intelligence for organizations that need reliable data quickly and cost-effectively. This streamlined offering delivers pre-defined datasets focused on specific markets, geographies, or product categories, enabling rapid access to the essential intelligence required for time-sensitive business decisions without the investment required for comprehensive reports or full database subscriptions. Whether you're preparing a quick competitive brief, validating a market opportunity, supporting an internal presentation, or conducting preliminary due diligence, Data on Demand delivers the specific market metrics and insights you need. This flexible solution bridges the gap between broad industry overviews and exhaustive research projects, providing the strategic sweet spot for professionals who require trustworthy, independently verified market data on accelerated timelines.
Revision Date: December 2025
Datasets: 200+
Formats: XLS, CSV
Breakdowns: Year, Country, End-User Industry, Product Type, Application, Form Factor, Distribution Channels and more...
Years Covered: 2024 Actual, 2025 Estimate, 2026-2030 Forecasts

Dedalus Consulting's Market Essentials reports provide the fundamental intelligence that serves as the foundation for sound strategic planning at an accessible entry-level price point. Designed for organizations seeking core market understanding without the investment required for comprehensive multi-volume analysis, Market Essentials delivers the critical data and insights necessary to grasp industry fundamentals, competitive dynamics, and key market drivers. Each report distills decades of specialized expertise into focused analysis covering essential market sizing, major player identification, primary end-user segments, and significant trend trajectories—the cornerstones upon which effective business strategies are built. This streamlined approach makes professional-grade market intelligence accessible to smaller organizations, individual business units, or teams conducting preliminary market assessment before committing to deeper research investments.
Revision Date: December 2025
Pages: 25
Tables/Charts/Graphs: 50+
Years Covered: 2024 Actual, 2025 Estimate, 2026-2040 Forecasts
Parametric Breakdowns: Year, Country, End-User Industry, Product Type, Application, Form Factor, Distribution Channels and more...
Companies Researched: 150+
Delivery Method: PDF, Printable – Five (5) User License

Dedalus Consulting's Single-Client Consulting Services provide customized market intelligence tailored to the strategic challenges that standard research cannot address. With over 25 years of proven expertise serving manufacturers, end-users, financial institutions, and academic organizations in the specialized industrial components sector, we deliver the targeted competitive analysis essential for market expansion strategies, new product launches, regional market entry decisions, and merger and acquisition due diligence. Our consulting methodology distinguishes itself through primary research interviews with industry participants across the value chain—from manufacturers and distributors to end-users—combined with proprietary data accumulated through decades of continuous market tracking in advanced manufacturing components. This approach leverages deep industry relationships built over a quarter-century to surface operational insights and competitive intelligence that secondary research sources simply cannot provide. When standard market reports fall short of addressing your specific strategic requirements, Dedalus Consulting's Single-Client services deliver the precision intelligence that drives confident, informed business decisions in rapidly evolving technology markets.
Key Capabilities:
- Market Entry & Expansion Analysis — Comprehensive assessment of regional opportunities, competitive landscapes, distribution channel requirements, and go-to-market strategies tailored to specific geographic or segment expansion objectives
- Merger & Acquisition Due Diligence — In-depth target company evaluation including market position validation, competitive threat assessment, customer relationship analysis, and strategic fit evaluation backed by primary research and proprietary market data
- New Product Launch Intelligence — Market readiness assessment, competitive response forecasting, pricing strategy development, and distribution channel optimization to maximize launch success and accelerate market penetration
- Competitive Benchmarking & Strategic Positioning — Detailed analysis of competitor capabilities, market share dynamics, differentiation strategies, and vulnerabilities to identify sustainable competitive advantages and strategic opportunities
- Supply Chain & Sourcing Strategy — Comprehensive supplier landscape mapping, alternative sourcing identification, supply chain risk assessment, and strategic procurement intelligence leveraging deep industry relationships and market knowledge

Dedalus Consulting's Competitive Profiles deliver comprehensive intelligence on key industry players in the specialized industrial components market, providing the detailed competitive analysis essential for strategic positioning, M&A due diligence, and market entry decisions. Each profile offers an in-depth examination of a company's competitive standing within the advanced manufacturing components industry, combining quantitative performance metrics with qualitative strategic assessment to reveal competitive strengths, vulnerabilities, and market trajectories. Our analyses include detailed breakdowns of sales performance and market share by product type, geographic region, and end-user segment, alongside examination of distribution channel strategies, manufacturing capabilities, technology portfolios, and go-to-market approaches. Key performance indicators cover revenue trends, profitability metrics, capacity utilization, R&D investment patterns, and product mix evolution, while competitive positioning analysis evaluates differentiation strategies, pricing power, customer relationships, and supply chain advantages.
Key Intelligence Components:
- Sales Performance & Market Share Analysis — Detailed revenue breakdowns by product line, geographic region, end-user segment, and distribution channel, with historical trends and market share positioning across specific industrial segments
- Strategic Positioning Assessment — Comprehensive evaluation of competitive differentiation strategies, pricing power, technology portfolios, manufacturing capabilities, and go-to-market approaches that define each company's competitive advantage
- Distribution & Channel Strategy Analysis — In-depth examination of sales channel mix, distributor relationships, direct sales capabilities, customer service infrastructure, and route-to-market effectiveness across geographic markets
- Financial & Operational Metrics — Key performance indicators including revenue trends, profitability analysis, capacity utilization, R&D investment patterns, product mix evolution, and operational efficiency benchmarks validated through primary research
- Competitive Strengths & Vulnerabilities — Strategic intelligence on management capabilities, innovation pipelines, customer relationships, supply chain advantages, technology gaps, and market positioning weaknesses that impact long-term competitive sustainability
